Prometheus Grafana setup
The PromQL endpoint and its temporal_cloud_v0_* metrics were deprecated on April 2, 2026 and are no longer accepting new users.
The PromQL endpoint will be disabled for all users on October 5, 2026.
For Grafana setup with the OpenMetrics endpoint, see the OpenMetrics integrations page.
How to set up Grafana with Temporal Cloud PromQL endpoint to view Cloud metrics.
Temporal Cloud emits metrics through a Prometheus HTTP API endpoint, which can be directly used as a Prometheus data source in Grafana or to query and export Cloud metrics to any observability platform.
For setting up SDK metrics (emitted by your Workers and Clients), see SDK metrics setup.
The process for setting up Temporal Cloud PromQL to work with Grafana includes the following steps:
- Generate a Prometheus HTTP API endpoint on Temporal Cloud using valid certificates.
- Run Grafana and set up a data source for Temporal Cloud metrics in Grafana.
- Create dashboards in Grafana to view Temporal Cloud metrics. Temporal provides sample community-driven Grafana dashboards for Cloud metrics that you can use and customize according to your requirements.
If you're following through with the examples provided here, ensure that you have the following:
-
Root CA certificates and end-entity certificates. See Certificate requirements for details.
-
Set up your connections to Temporal Cloud using an SDK of your choice and have some Workflows running on Temporal Cloud. See Connect to a Temporal Service for details.
-
Grafana installed.
Temporal Cloud metrics setup
Before you set up your Temporal Cloud metrics, ensure that you have the following:
- Account Owner or Global Admin role privileges for the Temporal Cloud account.
- CA certificate and key for the Observability integration. You will need the certificate to set up the Observability endpoint in Temporal Cloud.
The following steps describe how to set up Observability on Temporal Cloud to generate an endpoint:
- Log in to Temporal Cloud UI with an Account Owner or Global Admin role.
- Go to Settings and select Integrations.
- Select Configure Observability (if you're setting it up for the first time) or click Edit in the Observability section (if it was already configured before).
- Add your root CA certificate (.pem) and save it. Note that if an observability endpoint is already set up, you can append your root CA certificate here to use the generated observability endpoint with your instance of Grafana.
- To test your endpoint, run the following command on your host:
If you have Workflows running on a Namespace in your Temporal Cloud instance, you should see some data as a result of running this command.curl -v --cert <path to your client-cert.pem> --key <path to your client-cert.key> "<your generated Temporal Cloud prometheus_endpoint>/api/v1/query?query=temporal_cloud_v0_state_transition_count"
- Copy the HTTP API endpoint that is generated (it is shown in the UI).
This endpoint should be configured as a data source for Temporal Cloud metrics in Grafana. See Grafana data source configuration for details.
SDK metrics setup
SDK metrics are emitted by SDK Clients used to start your Workers and to start, signal, or query your Workflow Executions. You must configure a Prometheus scrape endpoint for Prometheus to collect and aggregate your SDK metrics. Each language development guide has details on how to set this up.
The following example uses the Java SDK to set the Prometheus registry and Micrometer stats reporter, set the scope, and expose an endpoint from which Prometheus can scrape the SDK metrics.
//You need the following packages to set up metrics in Java.
//See the Developer's guide for packages required for other SDKs.

//…
import com.sun.net.httpserver.HttpServer;
import com.uber.m3.tally.RootScopeBuilder;
import com.uber.m3.tally.Scope;
import com.uber.m3.util.Duration;
import com.uber.m3.util.ImmutableMap;

import io.micrometer.prometheus.PrometheusConfig;
import io.micrometer.prometheus.PrometheusMeterRegistry;
import io.temporal.common.reporter.MicrometerClientStatsReporter;

import java.io.IOException;
import java.io.OutputStream;
import java.net.InetSocketAddress;

import io.temporal.serviceclient.SimpleSslContextBuilder;
import io.temporal.serviceclient.WorkflowServiceStubs;
import io.temporal.serviceclient.WorkflowServiceStubsOptions;

import java.io.FileInputStream;
import java.io.InputStream;
//…
   {
     // See the Micrometer documentation for configuration details on other supported monitoring systems.
     // Set up the Prometheus registry.
     PrometheusMeterRegistry yourRegistry = new PrometheusMeterRegistry(PrometheusConfig.DEFAULT);

       public static Scope yourScope(){
     //Set up a scope, report every 10 seconds
       Scope yourScope = new RootScopeBuilder()
               .tags(ImmutableMap.of(
                       "customtag1",
                       "customvalue1",
                       "customtag2",
                       "customvalue2"))
               .reporter(new MicrometerClientStatsReporter(yourRegistry))
               .reportEvery(Duration.ofSeconds(10));

     //Start Prometheus scrape endpoint at port 8077 on your local host
     HttpServer scrapeEndpoint = startPrometheusScrapeEndpoint(yourRegistry, 8077);
     return yourScope;
   }

   /**
    * Starts HttpServer to expose a scrape endpoint. See
    * https://micrometer.io/docs/registry/prometheus for more info.
    */

   public static HttpServer startPrometheusScrapeEndpoint(
           PrometheusMeterRegistry yourRegistry, int port) {
       try {
           HttpServer server = HttpServer.create(new InetSocketAddress(port), 0);
           server.createContext(
                   "/metrics",
                   httpExchange -> {
                       String response = registry.scrape();
                       httpExchange.sendResponseHeaders(200, response.getBytes(UTF_8).length);
                       try (OutputStream os = httpExchange.getResponseBody()) {
                           os.write(response.getBytes(UTF_8));
                       }
                   });
           server.start();
           return server;
       } catch (IOException e) {
           throw new RuntimeException(e);
       }
   }
}

//…

// With your scrape endpoint configured, set the metrics scope in your Workflow service stub and
// use it to create a Client to start your Workers and Workflow Executions.

//…
{
    //Create Workflow service stubs to connect to the Frontend Service.
    WorkflowServiceStubs service = WorkflowServiceStubs.newServiceStubs(
               WorkflowServiceStubsOptions.newBuilder()
                      .setMetricsScope(yourScope()) //set the metrics scope for the WorkflowServiceStubs
                      .build());

   //Create a Workflow service client, which can be used to start, signal, and query Workflow Executions.
   WorkflowClient yourClient = WorkflowClient.newInstance(service,
          WorkflowClientOptions.newBuilder().build());
}

//…
To check whether your scrape endpoints are emitting metrics, run your code and go to http://localhost:8077/metrics to verify that you see the SDK metrics.
You can set up separate scrape endpoints in your Clients that you use to start your Workers and Workflow Executions.
For more examples on setting metrics endpoints in other SDKs, see the metrics samples:
Grafana data source configuration
How to configure the Temporal Cloud metrics data source in Grafana.
Depending on how you use Grafana, you can either install and run it locally, run it as a Docker container, or log in to Grafana Cloud to set up your data sources.
If you have installed and are running Grafana locally, go to http://localhost:3000 and sign in.
To add the Temporal Cloud Prometheus HTTP API endpoint that we generated in the Temporal Cloud metrics setup section, do the following:
- Go to Configuration > Data sources.
- Select Add data source > Prometheus.
- Enter a name for your Temporal Cloud metrics data source, such as Temporal Cloud metrics.
- In the Connection section, paste the URL that was generated in the Observability section on the Temporal Cloud UI.
- The Authentication section may be left as No Authentication.
- In the TLS Settings section, select TLS Client Authentication:
- Leave ServerName blank. This is not required.
- Paste in your end-entity certificate and key.
- Note that the end-entity certificate used here must be part of the certificate chain with the root CA certificates
used in your Temporal Cloud observability setup.
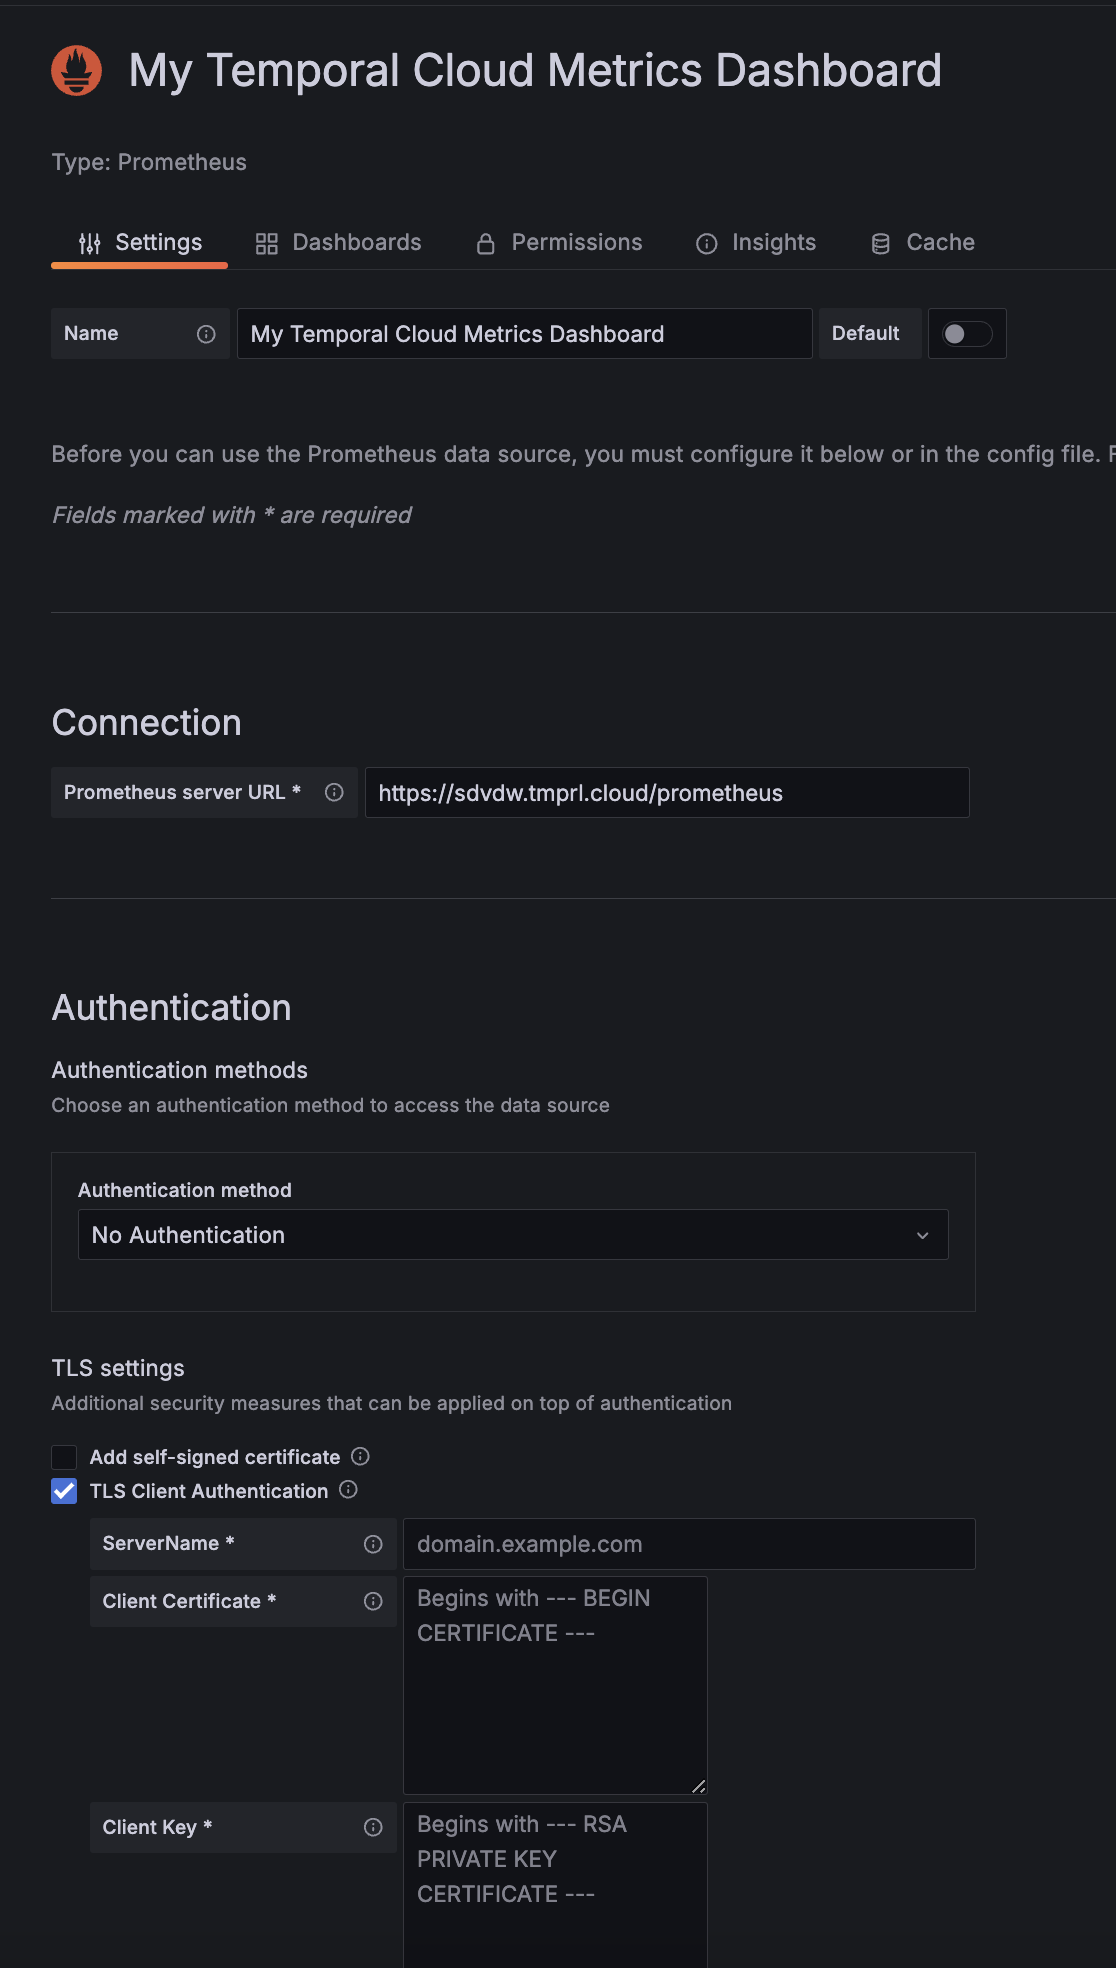
- Click Save and test to verify that the data source is working.
If you see issues in setting this data source, verify your CA certificate chain and ensure that you are setting the correct certificates in your Temporal Cloud observability setup and in the TLS authentication in Grafana.
Grafana dashboards setup
To set up dashboards in Grafana, you can use the UI or configure them directly in your Grafana deployment.
Temporal provides community-driven example dashboards for Temporal Cloud that you can customize to meet your needs.
To import a dashboard in Grafana:
- In the left-hand navigation bar, select Dashboards > Import dashboard.
- You can either copy and paste the JSON from the Temporal Cloud sample dashboards, or import the JSON files into Grafana.
- Save the dashboard and review the metrics data in the graphs.
To configure dashboards with the UI:
- Go to Create > Dashboard and add an empty panel.
- On the Panel configuration page, in the Query tab, select the "Temporal Cloud metrics" data source that you configured earlier.
- Expand the Metrics browser and select the metrics you want. You can also select associated labels and values to sort the query data. The PromQL documentation lists all metrics emitted from PromQL in Temporal Cloud.
- The graph should now display data based on your selected queries.