OpenMetrics migration guide
Temporal Cloud is transitioning from our Prometheus query endpoint to an industry-standard OpenMetrics (Prometheus-compatible) endpoint for metrics collection. This migration represents a significant improvement in how you can monitor your Temporal Cloud workloads, bringing enhanced capabilities, better integration with observability tools, and access to high-cardinality metrics that were previously unavailable.
The PromQL endpoint was deprecated on April 2, 2026 and is no longer accepting new users. The PromQL endpoint will be disabled for all users on October 5, 2026. Complete your migration to the OpenMetrics endpoint before this date.
Why We're Making This Change
-
Industry-Standard Format: Native compatibility with Prometheus and OpenTelemetry and all major observability platforms (Datadog, New Relic etc.) without custom integrations.
-
High-Cardinality Metrics: Access to previously unavailable dimensions including:
temporal_task_queuelabels on multiple metricstemporal_workflow_typelabels for workflow-specific monitoring- New task queue backlog metrics for better operational visibility
-
Accurate Percentiles: Our new system provides accurate percentile calculations for latency metrics, even in the presence of substantial outliers, unlike Prometheus-style histograms.
-
Simplified Integration: Direct scraping from your observability tools without intermediate translation layers.
-
Enhanced Performance: Optimized for high-cardinality data with built-in safeguards for system stability. Data is available to scrape three minutes from the time it was emitted, in line with the freshest metrics available from any major service provider.
What's Changing
| Aspect | Current Query Endpoint | New OpenMetrics Endpoint |
|---|---|---|
| Protocol | Prometheus Query API (/api/v1/query) | OpenMetrics scrape endpoint (/v1/metrics) |
| Authentication | mTLS certificates with customer-specific endpoints | API keys with global endpoint |
| Metric Temporality | Cumulative counters | Delta temporality (pre-computed rates) |
| Query Requirement | Direct queries supported | Requires observability platform |
| Cardinality | Limited labels | High-cardinality labels available |
| Metric Naming | *_v0_* metrics | *_v1_* metrics |
Migration Timeline
April 2, 2026 - PromQL endpoint deprecated
- The PromQL endpoint is no longer accepting new users.
- Existing users should begin migrating to the OpenMetrics endpoint.
October 5, 2026 - PromQL endpoint disabled
- The PromQL endpoint will be disabled for all users.
- All metrics consumption must use the OpenMetrics endpoint by this date.
Complete migration before October 5, 2026.
Notable Differences
1. No longer use rate() in Prometheus queries
Metrics are now pre-computed as per-second rates with delta temporality.
Before (Prometheus query endpoint):
rate(temporal_cloud_v0_frontend_service_request_count[1m])
After (OpenMetrics endpoint):
temporal_cloud_v1_service_request_count
2. Functions that no longer apply
Metrics from OpenMetrics are already rates, therefore certain Prometheus functions no longer make sense. Below is a non-exhaustive list of some of the functions:
- ❌
rate()- Already computed - ❌
increase()- Increase of a rate is meaningless - ❌
irate()- Instant rate not applicable - ❌
histogram_quantile()- Not applicable (explicit percentiles provided instead) - ✅
sum(),avg(),max(),min()- Still work normally
3. Percentile metrics
The new endpoint provides explicit percentile metrics (p50, p95, p99) rather than histogram buckets:
Before (Prometheus query endpoint): Calculate percentiles using histogram_quantile()
histogram_quantile(0.95, rate(temporal_cloud_v0_service_latency_bucket[5m]))
After (OpenMetrics endpoint): Use pre-calculated percentiles directly
temporal_cloud_v1_service_latency_p95
Important Tradeoff: While pre-calculated percentiles are more accurate for individual time series, they cannot be accurately aggregated. For example:
- ❌ Cannot sum or average p95 values across Namespaces to get a global p95
- ❌ Cannot aggregate p95 values across regions or Task Queues
- ✅ Can still view individual namespace/task queue percentiles accurately
- ✅ More accurate percentile calculations for individual series, especially with outliers
The v0 latency metrics are a histogram, not a percentile. Dividing temporal_cloud_v0_service_latency_sum by
temporal_cloud_v0_service_latency_count yields an average (roughly a p50), and a single
temporal_cloud_v0_service_latency_bucket{le="..."} series only counts requests below a threshold. Neither is a p95
or p99.
If your v0 alert compared an average (or a raw _sum / _bucket value) against a latency threshold, switching to
temporal_cloud_v1_service_latency_p95 / _p99 reports higher values for identical traffic. This is a measurement
change, not a latency regression.
To migrate latency alerts safely:
- Compare like-for-like. To reproduce a former average-based alert, start on
temporal_cloud_v1_service_latency_p50, then move to_p95/_p99deliberately once you have set an appropriate threshold. - Confirm which percentile your SLO targets. The Temporal Cloud latency SLO is a p99; alerting on p95 against a p99 threshold trips earlier than the SLO.
4. Authentication Setup
Before: mTLS certificates with customer-specific endpoint
curl --cert /path/to/client.pem \
     --key /path/to/client.key \
     --cacert /path/to/ca.pem \

"https://<customer-specific>.tmprl.cloud/api/v1/query?query=rate(temporal_cloud_v0_frontend_service_request_count[5m])&time=2025-01-15T10:00:00Z"
After: API key with global endpoint
curl -H "Authorization: Bearer <API_KEY>" https://metrics.temporal.io/v1/metrics
Migration Steps
Create an API Key
Create a service account within the Temporal Cloud UI settings with the “Metrics Read-Only” Account Level Role.
As this is an account-level role, scoping it to specific namespaces has no effect as it will have access to the full account’s metrics.
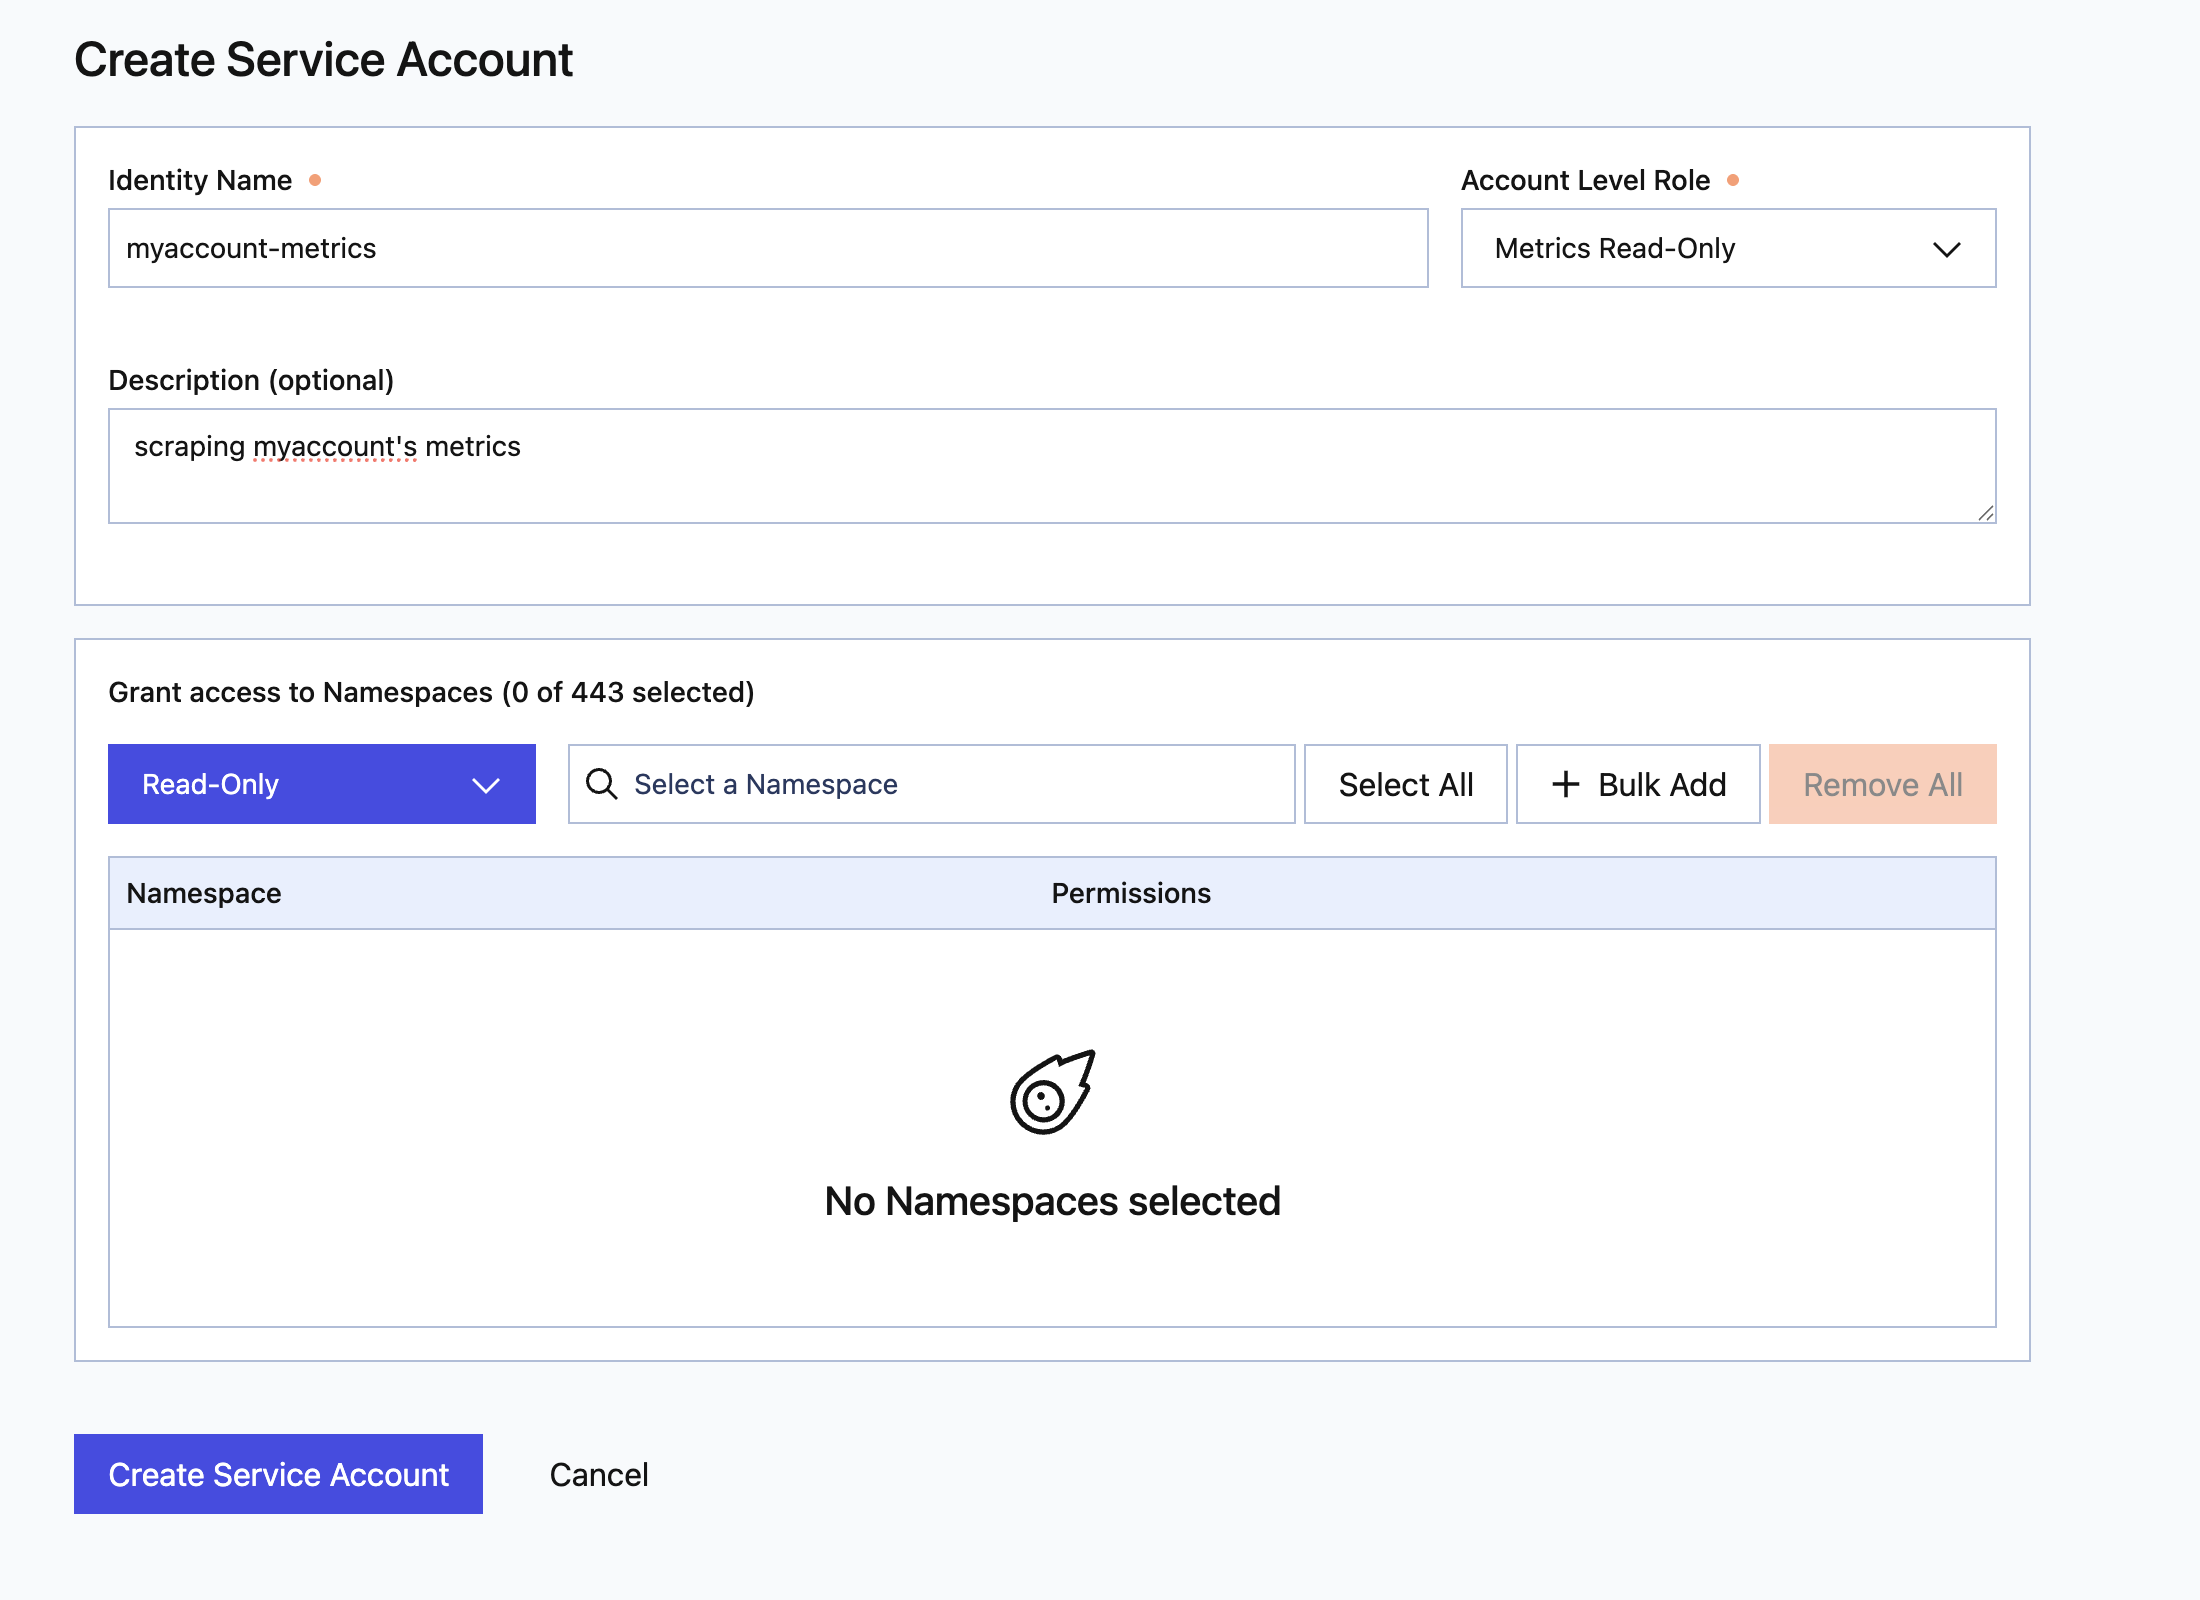
Create Service Account with Metrics Read-Only Role
Once this is created, you can create an API key within this service account which will inherit the role. Save this API key in a secure location and use it to access the metrics APIs.
To test that this works, curl the endpoint with your API Key.
The output should resemble the following example:
$ curl -H "Authorization: Bearer <API_KEY>" https://metrics.temporal.io/v1/metrics

# TYPE temporal_cloud_v1_service_error_count gauge
# HELP temporal_cloud_v1_service_error_count The number of gRPC errors returned by frontend service
# TYPE temporal_cloud_v1_service_pending_requests gauge
# HELP temporal_cloud_v1_service_pending_requests The number of pollers that are waiting for a task
# TYPE temporal_cloud_v1_service_request_count gauge
# HELP temporal_cloud_v1_service_request_count The number of RPC requests received by the service..
Now you are ready to scrape your metrics!
Configuring Grafana + Prometheus
Update Prometheus Configuration
Add a new scrape job for the OpenMetrics endpoint with your API key.
scrape_configs:
  - job_name: temporal-cloud
    static_configs:
      - targets:
          - 'metrics.temporal.io'
    scheme: https
    metrics_path: '/v1/metrics'
    honor_timestamps: true
    scrape_interval: 30s
    scrape_timeout: 30s
    authorization:
      type: Bearer
      credentials: 'API_KEY'
This replaces the direct Grafana datasource configuration you used with the query endpoint.
Install New Dashboards
- Download the new Grafana dashboard: temporal_cloud_openmetrics.json
- Import alongside existing dashboards during transition
- Update any custom alerts and queries to use new metrics and remove
rate()functions
Other Observability Providers
Consult the documentation for your observability system for how to configure it to scrape this endpoint and retrieve your metrics:
Examples for all these integrations live here.
Metric Mapping Reference
Below is a template for mapping metrics from the old query endpoint to the new OpenMetrics endpoint. Note that all metrics follow the pattern of v0 → v1 version change, and the fundamental difference is the shift from cumulative counters to pre-computed rates for the majority of the metrics. Note that the labels below are only new labels added to the metrics. For the complete list of labels, see the /cloud/metrics/openmetrics/metrics-reference.
Frontend Service Metrics
| Old Metric (v0) | New Metric (v1) | New Labels |
|---|---|---|
temporal_cloud_v0_frontend_service_error_count | temporal_cloud_v1_service_error_count | region |
temporal_cloud_v0_frontend_service_request_count | temporal_cloud_v1_service_request_count | region |
temporal_cloud_v0_resource_exhausted_error_count | temporal_cloud_v1_resource_exhausted_error_count | region |
temporal_cloud_v0_state_transition_count | No direct equivalent | - |
temporal_cloud_v0_total_action_count | temporal_cloud_v1_total_action_count | region |
temporal_cloud_v0_state_transition_count does not have an equivalent metric in the OpenMetrics endpoint.
To size workloads for Temporal Cloud (for example, when migrating from self-hosted), use action-based metrics (temporal_cloud_v1_total_action_count) and request-based metrics (temporal_cloud_v1_service_request_count) together instead.
Workflow Metrics
| Old Metric (v0) | New Metric (v1) | New Labels |
|---|---|---|
temporal_cloud_v0_workflow_cancel_count | temporal_cloud_v1_workflow_cancel_count | region temporal_workflow_type temporal_task_queue |
temporal_cloud_v0_workflow_continued_as_new_count | temporal_cloud_v1_workflow_continued_as_new_count | region temporal_workflow_type temporal_task_queue |
temporal_cloud_v0_workflow_failed_count | temporal_cloud_v1_workflow_failed_count | region temporal_workflow_type temporal_task_queue |
temporal_cloud_v0_workflow_success_count | temporal_cloud_v1_workflow_success_count | region temporal_workflow_type temporal_task_queue |
temporal_cloud_v0_workflow_terminate_count | temporal_cloud_v1_workflow_terminate_count | region temporal_workflow_type temporal_task_queue |
temporal_cloud_v0_workflow_timeout_count | temporal_cloud_v1_workflow_timeout_count | region temporal_workflow_type temporal_task_queue |
Poll Metrics
| Old Metric (v0) | New Metric (v1) | New Labels |
|---|---|---|
temporal_cloud_v0_poll_success_count | temporal_cloud_v1_poll_success_count | region temporal_task_queue |
temporal_cloud_v0_poll_success_sync_count | temporal_cloud_v1_poll_success_sync_count | region temporal_task_queue |
temporal_cloud_v0_poll_timeout_count | temporal_cloud_v1_poll_timeout_count | region temporal_task_queue |
Latency Metrics
| Old Metric (v0) | New Metric (v1) | New Labels |
|---|---|---|
temporal_cloud_v0_service_latency_bucket temporal_cloud_v0_service_latency_count temporal_cloud_v0_service_latency_sum | temporal_cloud_v1_service_latency_p99 temporal_cloud_v1_service_latency_p95 temporal_cloud_v1_service_latency_p50 | region |
temporal_cloud_v0_replication_lag_bucket temporal_cloud_v0_replication_lag_count temporal_cloud_v0_replication_lag_sum | temporal_cloud_v1_replication_lag_p99 temporal_cloud_v1_replication_lag_p95 temporal_cloud_v1_replication_lag_p50 | region |
Schedule Metrics
| Old Metric (v0) | New Metric (v1) | New Labels |
|---|---|---|
temporal_cloud_v0_schedule_action_success_count | temporal_cloud_v1_schedule_action_success_count | region |
temporal_cloud_v0_schedule_buffer_overruns_count | temporal_cloud_v1_schedule_buffer_overruns_count | region |
temporal_cloud_v0_schedule_missed_catchup_window_count | temporal_cloud_v1_schedule_missed_catchup_window_count | region |
temporal_cloud_v0_schedule_rate_limited_count | temporal_cloud_v1_schedule_rate_limited_count | region |
In addition to these metrics, there are a number of new metrics provided by our OpenMetrics endpoint.
See the metrics reference for an up-to-date list of all available metrics and their full descriptions.
Managing High-Cardinality
The new endpoint provides access to high-cardinality labels that can significantly increase your metric volume:
High-Cardinality Labels
temporal_task_queuetemporal_workflow_type
Best Practices
Namespace/Metric filtering
Namespace filtering can be used to ensure that metrics are scraped for relevant Namespaces, which reduces cardinality.
https://metrics.temporal.io/v1/metrics?namespaces=production-*
This can be taken further by only scraping relevant metrics for a given namespace which ensures that any new high cardinality metrics won’t be an issue for your observability system.
https://metrics.temporal.io/v1/metrics?metrics=temporal_cloud_v1_workflow_success_count?namespaces=production-*
Relabeling
If the above doesn’t work, consider dropping problematic labels post-scrape but pre-ingestion into your observability system.
For example, in Prometheus this can be done via relabeling rules.
metric_relabel_configs:
- source_labels: [__name__]
  regex: 'temporal_cloud_v1_poll_success_count'
  action: labeldrop
  regex: 'temporal_task_queue'
Or you can even relabel certain label values in order to keep significant ones. For example, it’s possible to rename less important task queues to “unknown” while retaining important ones.
metric_relabel_configs:
  - source_labels: [temporal_task_queue]
    regex: '(critical-queue|payment-queue)'
    target_label: __tmp_keep_original
    replacement: 'true'
  # For anything without the keep flag, replace with "unknown"
  - source_labels: [__tmp_keep_original]
    regex: '' # empty/missing value
    target_label: temporal_task_queue
    replacement: 'unknown'
  # Clean up the temporary label
  - regex: '__tmp_keep_original'
    action: labeldrop
Limits
See API limits for details.
FAQ
What new metrics are available in OpenMetrics that are not available in PromQL?
OpenMetrics provides visibility into several new areas
- Activity execution and latency: completion outcomes (success, fail, timeout, cancel, terminate, plus activity-task-level fail/timeout) and latency percentiles (start-to-close, schedule-to-close), including Standalone Activities.
- Task queue health: approximate backlog depth and a rate of tasks added to queues with no active pollers.
- Namespace utilization and rate limits: operations counters, throttled-action and throttled-operation rates, a billable-action breakdown, an open-workflow gauge, and configured-limit and on-demand-envelope-limit gauges to chart usage against quotas.
- Usage against limits: a request-throttled rate and a pending-requests (active long-pollers) gauge.
- Higher-dimensional breakdowns: new labels including region, task queue, workflow type, activity type, worker deployment, and more.
New metrics:
temporal_cloud_v1_service_request_throttled_counttemporal_cloud_v1_service_pending_requeststemporal_cloud_v1_activity_success_counttemporal_cloud_v1_activity_fail_counttemporal_cloud_v1_activity_timeout_counttemporal_cloud_v1_activity_task_fail_counttemporal_cloud_v1_activity_task_timeout_counttemporal_cloud_v1_activity_cancel_counttemporal_cloud_v1_activity_terminate_counttemporal_cloud_v1_activity_start_to_close_latency_p50/_p95/_p99temporal_cloud_v1_activity_schedule_to_close_latency_p50/_p95/_p99temporal_cloud_v1_approximate_backlog_counttemporal_cloud_v1_no_poller_tasks_counttemporal_cloud_v1_namespace_open_workflowstemporal_cloud_v1_billable_action_counttemporal_cloud_v1_total_action_throttled_counttemporal_cloud_v1_operations_counttemporal_cloud_v1_operations_throttled_counttemporal_cloud_v1_action_limittemporal_cloud_v1_operations_limittemporal_cloud_v1_service_request_limittemporal_cloud_v1_poller_limittemporal_cloud_v1_action_on_demand_envelope_limittemporal_cloud_v1_operations_on_demand_envelope_limittemporal_cloud_v1_service_request_on_demand_envelope_limit
New labels:
regiontemporal_task_queuetemporal_workflow_typetask_typetask_priorityis_backgroundnamespace_modeaction_typetimeout_typetemporal_activity_type(opt-in)temporal_worker_deployment_name(opt-in)temporal_worker_build_id(opt-in)worker_version(opt-in)
For full descriptions, types, and per-metric labels, see the OpenMetrics metrics reference.
Will metrics match between promQL and OpenMetrics endpoints?
No. The metrics will be approximately the same but due to aggregation differences and windowing, values likely won't
match exactly between the two endpoints. Some metrics may be consistently different such as
temporal_cloud_v1_total_action_count which includes History Export actions in the OpenMetrics endpoint. In the case of
consistent differences the OpenMetrics endpoint is considered to be more accurate.
Can I still query metrics directly (e.g. with a Grafana dashboard)?
Currently, the OpenMetrics endpoint requires an observability platform to collect and query metrics. Direct querying via API to return a time series of data is not supported. Supporting this type of query pattern is a future roadmap item.
What happens to my existing dashboards and alerts?
During the transition period, both endpoints remain active.
Will historical data be preserved?
Historical data from the query endpoint will remain in your observability platform. To maintain continuity:
- Combine old (
v0) and new (v1) metrics in your queries during transition - Consider using the PromQL
oroperator:metric_v1 or metric_v0
Are there limits to how frequently I can scrape or how much data will be returned?
The limits are documented here.
Why are some metrics missing from my scrapes? I don’t see all the metrics documented.
The OpenMetrics endpoint only returns metrics that were generated during the one-minute aggregation window. This is different from the query endpoint which might return zeros.
What this means:
- If no workflows failed in the last minute,
temporal_cloud_v1_workflow_failed_countwon't appear in that scrape. - If a specific task queue had no activity, its metrics will be absent.
- The set of metrics returned varies between scrapes based on system activity.
This is normal behavior. Unlike some metrics systems that populate zeros, the OpenMetrics endpoint follows a sparse reporting pattern - metrics only appear when there's actual data to report.
How to handle this in queries:
(temporal_cloud_v1_workflow_failed_count{namespace="production"} or vector(0))
This ensures your dashboards and alerts work correctly even when metrics are temporarily absent due to no activity.