Monitor Temporal Platform metrics
The Temporal Service and SDKs emit metrics that can be used to monitor performance and troubleshoot issues. You can relay these metrics to any monitoring and observability platform.
This guide will provide an example of configuring Prometheus and Grafana to work with the observability metrics emitted from Temporal. This solution can work on its own, or serve as a baseline for you to further customize and integrate with other observability tooling. For example, it is also possible to use the OpenTelemetry Collector in your stack instead of scraping metrics directly with Prometheus, or Datadog as a frontend instead of Grafana.
This configuration assumes that you have Docker installed and are running a Temporal dev server via the CLI.
Prometheus
This section discusses exporting metrics from Temporal SDKs, and setting up Prometheus to collect metrics on Temporal Service, Temporal Client, and Temporal Worker performance.
The Temporal Service and SDKs emit all metrics by default. However, you must enable Prometheus in your application code (using the Temporal SDKs) and your Temporal Service configuration to collect the metrics emitted from your SDK and Temporal Service.
First, you'll need to create a prometheus.yml configuration file with some target ports to collect metrics from.
Here is a sample with one Temporal Service metrics target and two Temporal Worker (SDK) metrics targets:
global:
 scrape_interval: 10s
scrape_configs:
 - job_name: 'temporalmetrics'
   metrics_path: /metrics
   scheme: http
   static_configs:
     # Temporal Service metrics target
     - targets:
         - 'host.docker.internal:8000'
       labels:
         group: 'server-metrics'

     # Local app targets (set in SDK code)
     - targets:
         - 'host.docker.internal:8077'
         - 'host.docker.internal:8078'
       labels:
         group: 'sdk-metrics'
In this example, Prometheus is configured to scrape at 10-second intervals and to listen for Temporal Service metrics on host.docker.internal:8000 and SDK metrics on two targets, host.docker.internal:8077 and host.docker.internal:8078.
The 8077 and 8078 ports must be set on WorkflowServiceStubs in your application code with your preferred SDK -- there is an example of this in the next section.
You can set up as many targets as required.
For further Prometheus configuration options, refer to the Prometheus documentation.
You can use Docker to run the official Prometheus image with this configuration:
docker run -p 9090:9090 -v /path/to/prometheus.yml /etc/prometheus/prometheus.yml prom/prometheus
Next, launch your Temporal dev server from the CLI with an additional --metrics-port 8000 parameter:
temporal server start-dev --metrics-port 8000
Refer to the Temporal Cluster configuration reference to expose metrics from a production service.
You should now have both Prometheus and a Temporal Service running locally, with Temporal providing Service metrics to Prometheus. Next, you'll want to configure SDK metrics as well.
SDK metrics setup
SDK metrics are emitted by Temporal Workers and other Clients, and must be configured in your application code. The Metrics section in the Observability guide details how to create hooks for all supported SDKs:
For end-to-end examples of how to expose metrics from each SDK, see the metrics samples:
Some of these may require you to set different metrics port numbers based on the Prometheus example here, which is configured to scrape port 8077 and 8078 by default.
Follow the instructions from each of the samples to run Workflows and begin emitting metrics.
This will allow you to populate a dashboard in the next section and understand how to further customize Temporal observability for your needs.
Verifying Prometheus configuration
Once your Workflows are running and emitting metrics, you can visit http://localhost:9090/targets on your local Prometheus instance to verify that it is able to scrape the provided endpoints.
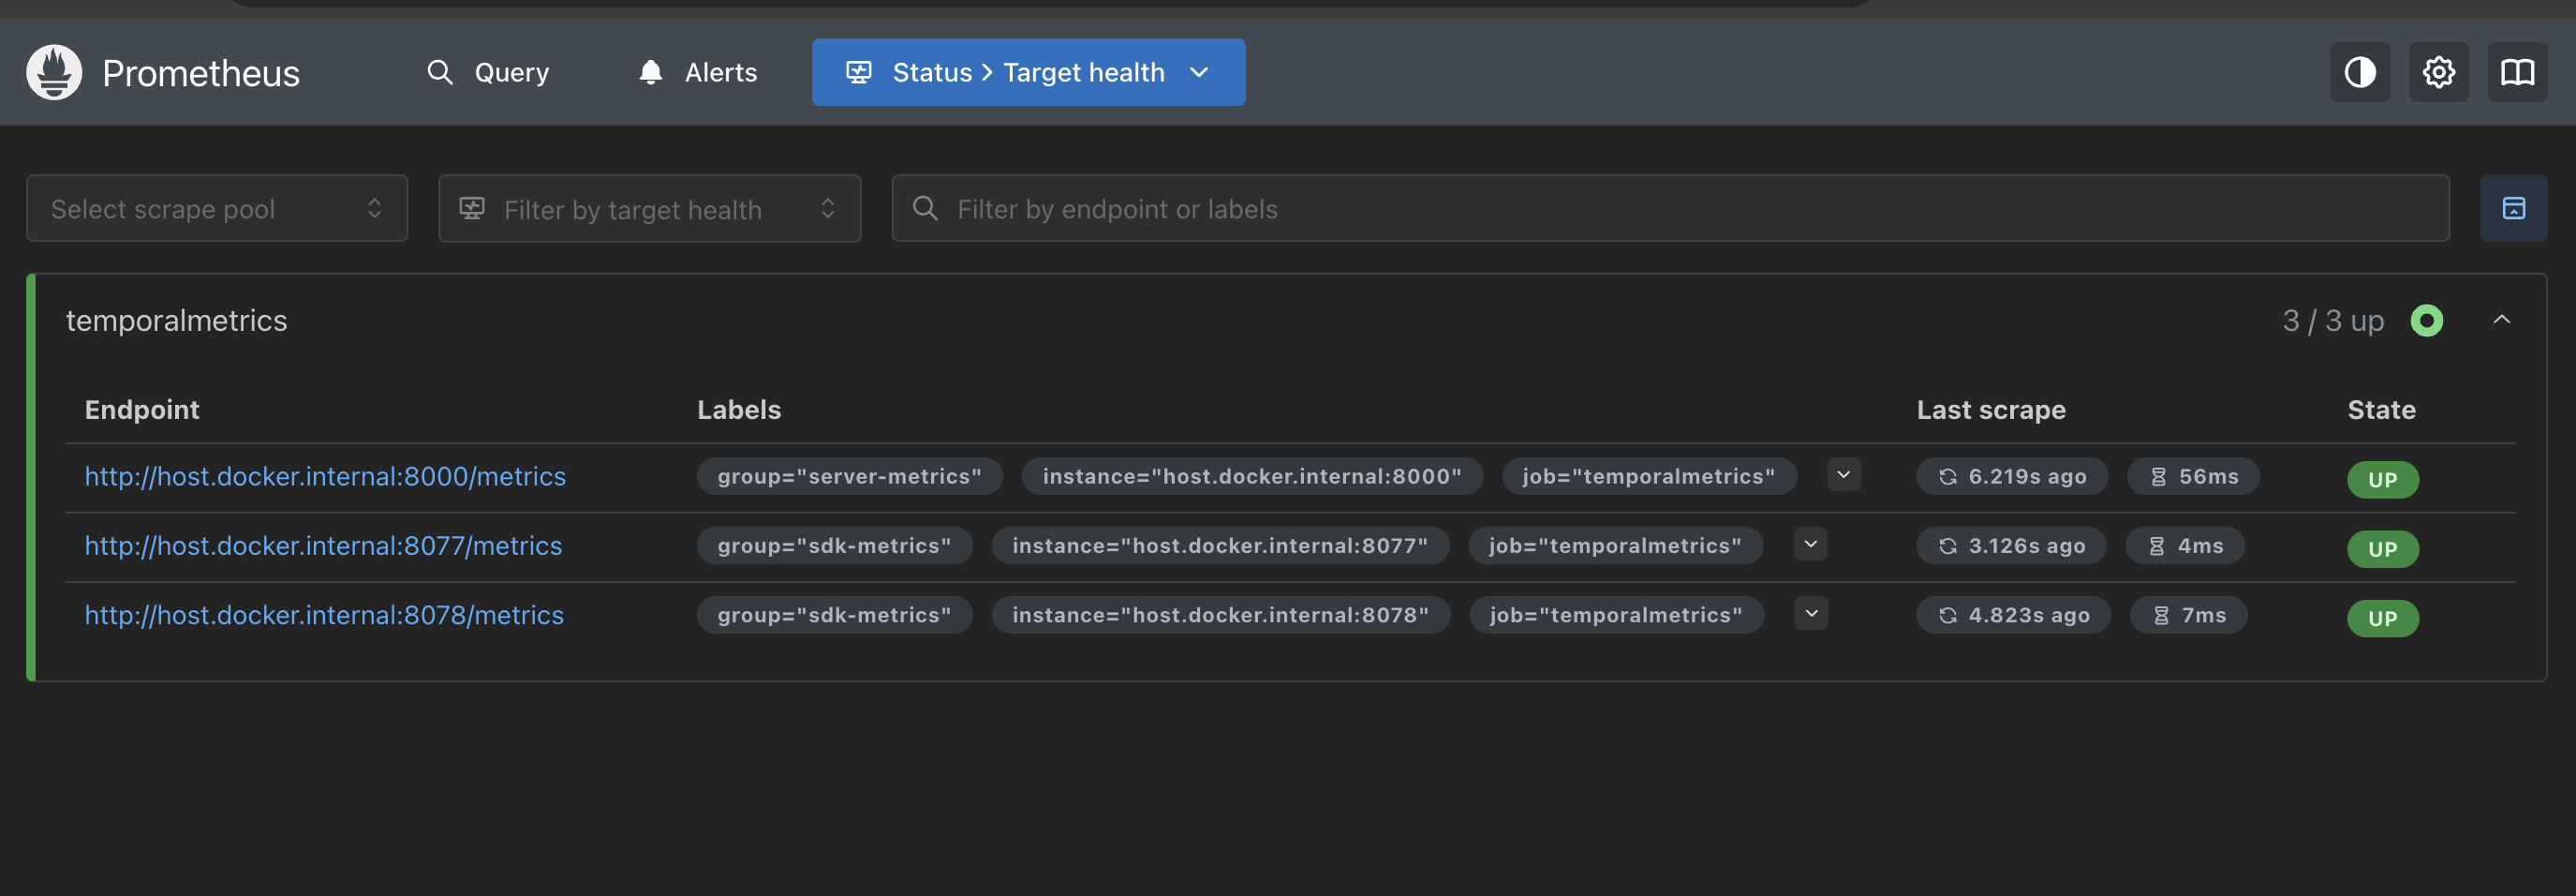
This example shows a response from the server metrics endpoint, provided by the Temporal dev server, and two SDK metrics endpoints, as defined in the Prometheus configuration. To create this example, we used the Go and Python metrics samples, running on port 8077 and 8088 respectively. If you are not pushing data to exactly 3 metrics endpoints, your environment may be different.
Next, you can visit the local Prometheus query endpoint to manually run PromQL queries on your exported metrics, or proceed to the next section to configure Grafana to generate dashboards from those metrics.
Grafana
With Prometheus configured, deploy Grafana as a metrics frontend, and configure it to use Prometheus as a data source.
As before, you can use Docker to run the official Grafana image:
docker run -d -p 3000:3000 grafana/grafana-enterprise
This will deploy a Grafana instance with a default username and password of admin/admin.
In production, you would want to configure authentication and control port access to Grafana.
For more information on how to customize your Grafana setup, see the Grafana documentation.
Next, configure Grafana to use Prometheus as the data source. To do this, click on "Add new data source" from the "Connections" menu in the Grafana sidebar, and add Prometheus from the list.
You will be prompted to add additional configuration parameters.
If you are following this guide using Docker, use http://host.docker.internal:9090 as the Prometheus address.
This is a DNS name provided by Docker Desktop which resolves to the internal IP address used by the host machine, and allows you to connect applications across Docker containers without additional configuration rules.
This is the only parameter you will need to set for your Prometheus configuration.
After providing it, scroll down to the "Save and Test" button, and you can validate Prometheus as a data source for this Grafana instance.
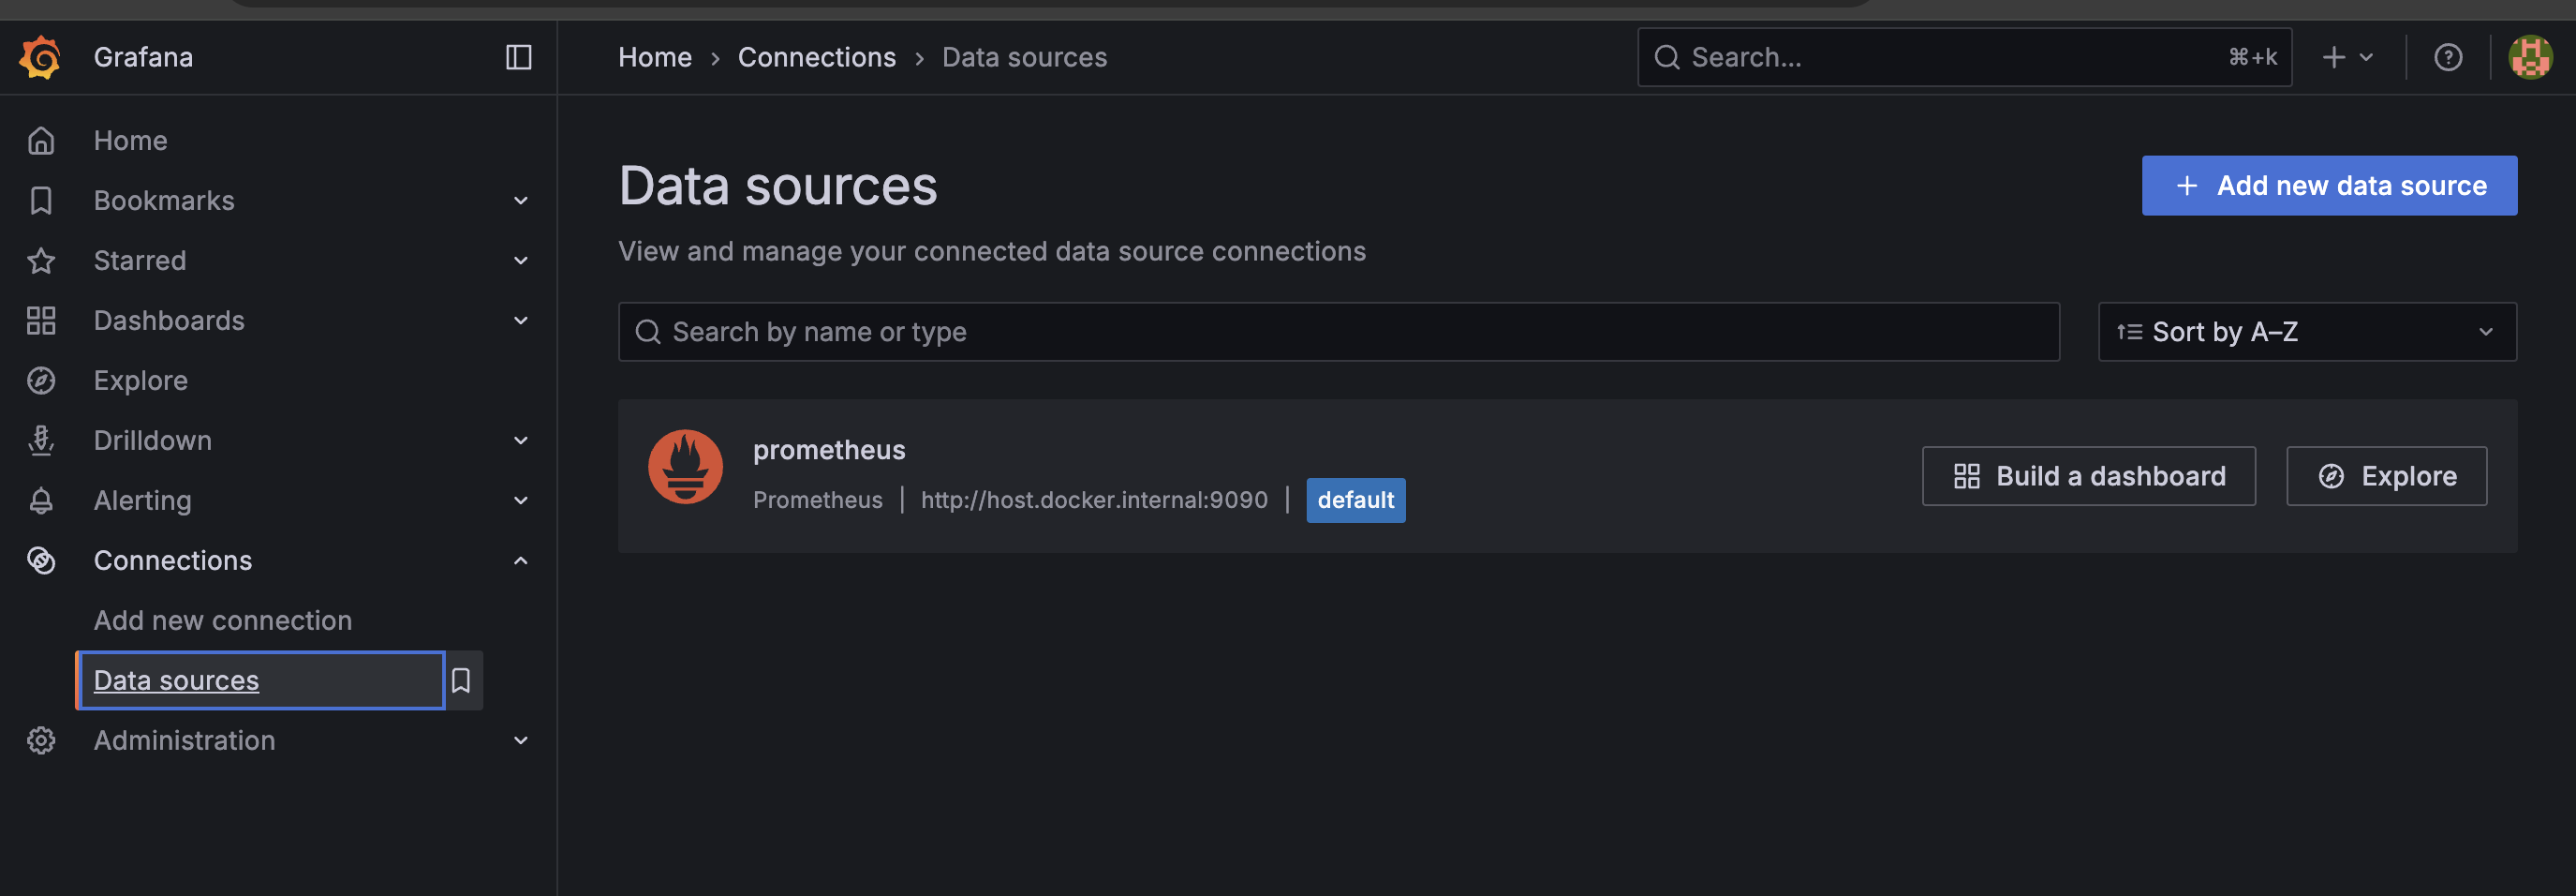
In this example, Grafana is set to pull metrics from Prometheus at the port 9090, as defined in the Prometheus configuration.
Now, you'll just need to add some of our provided dashboards for visualizing Temporal metrics.
Dashboard setup
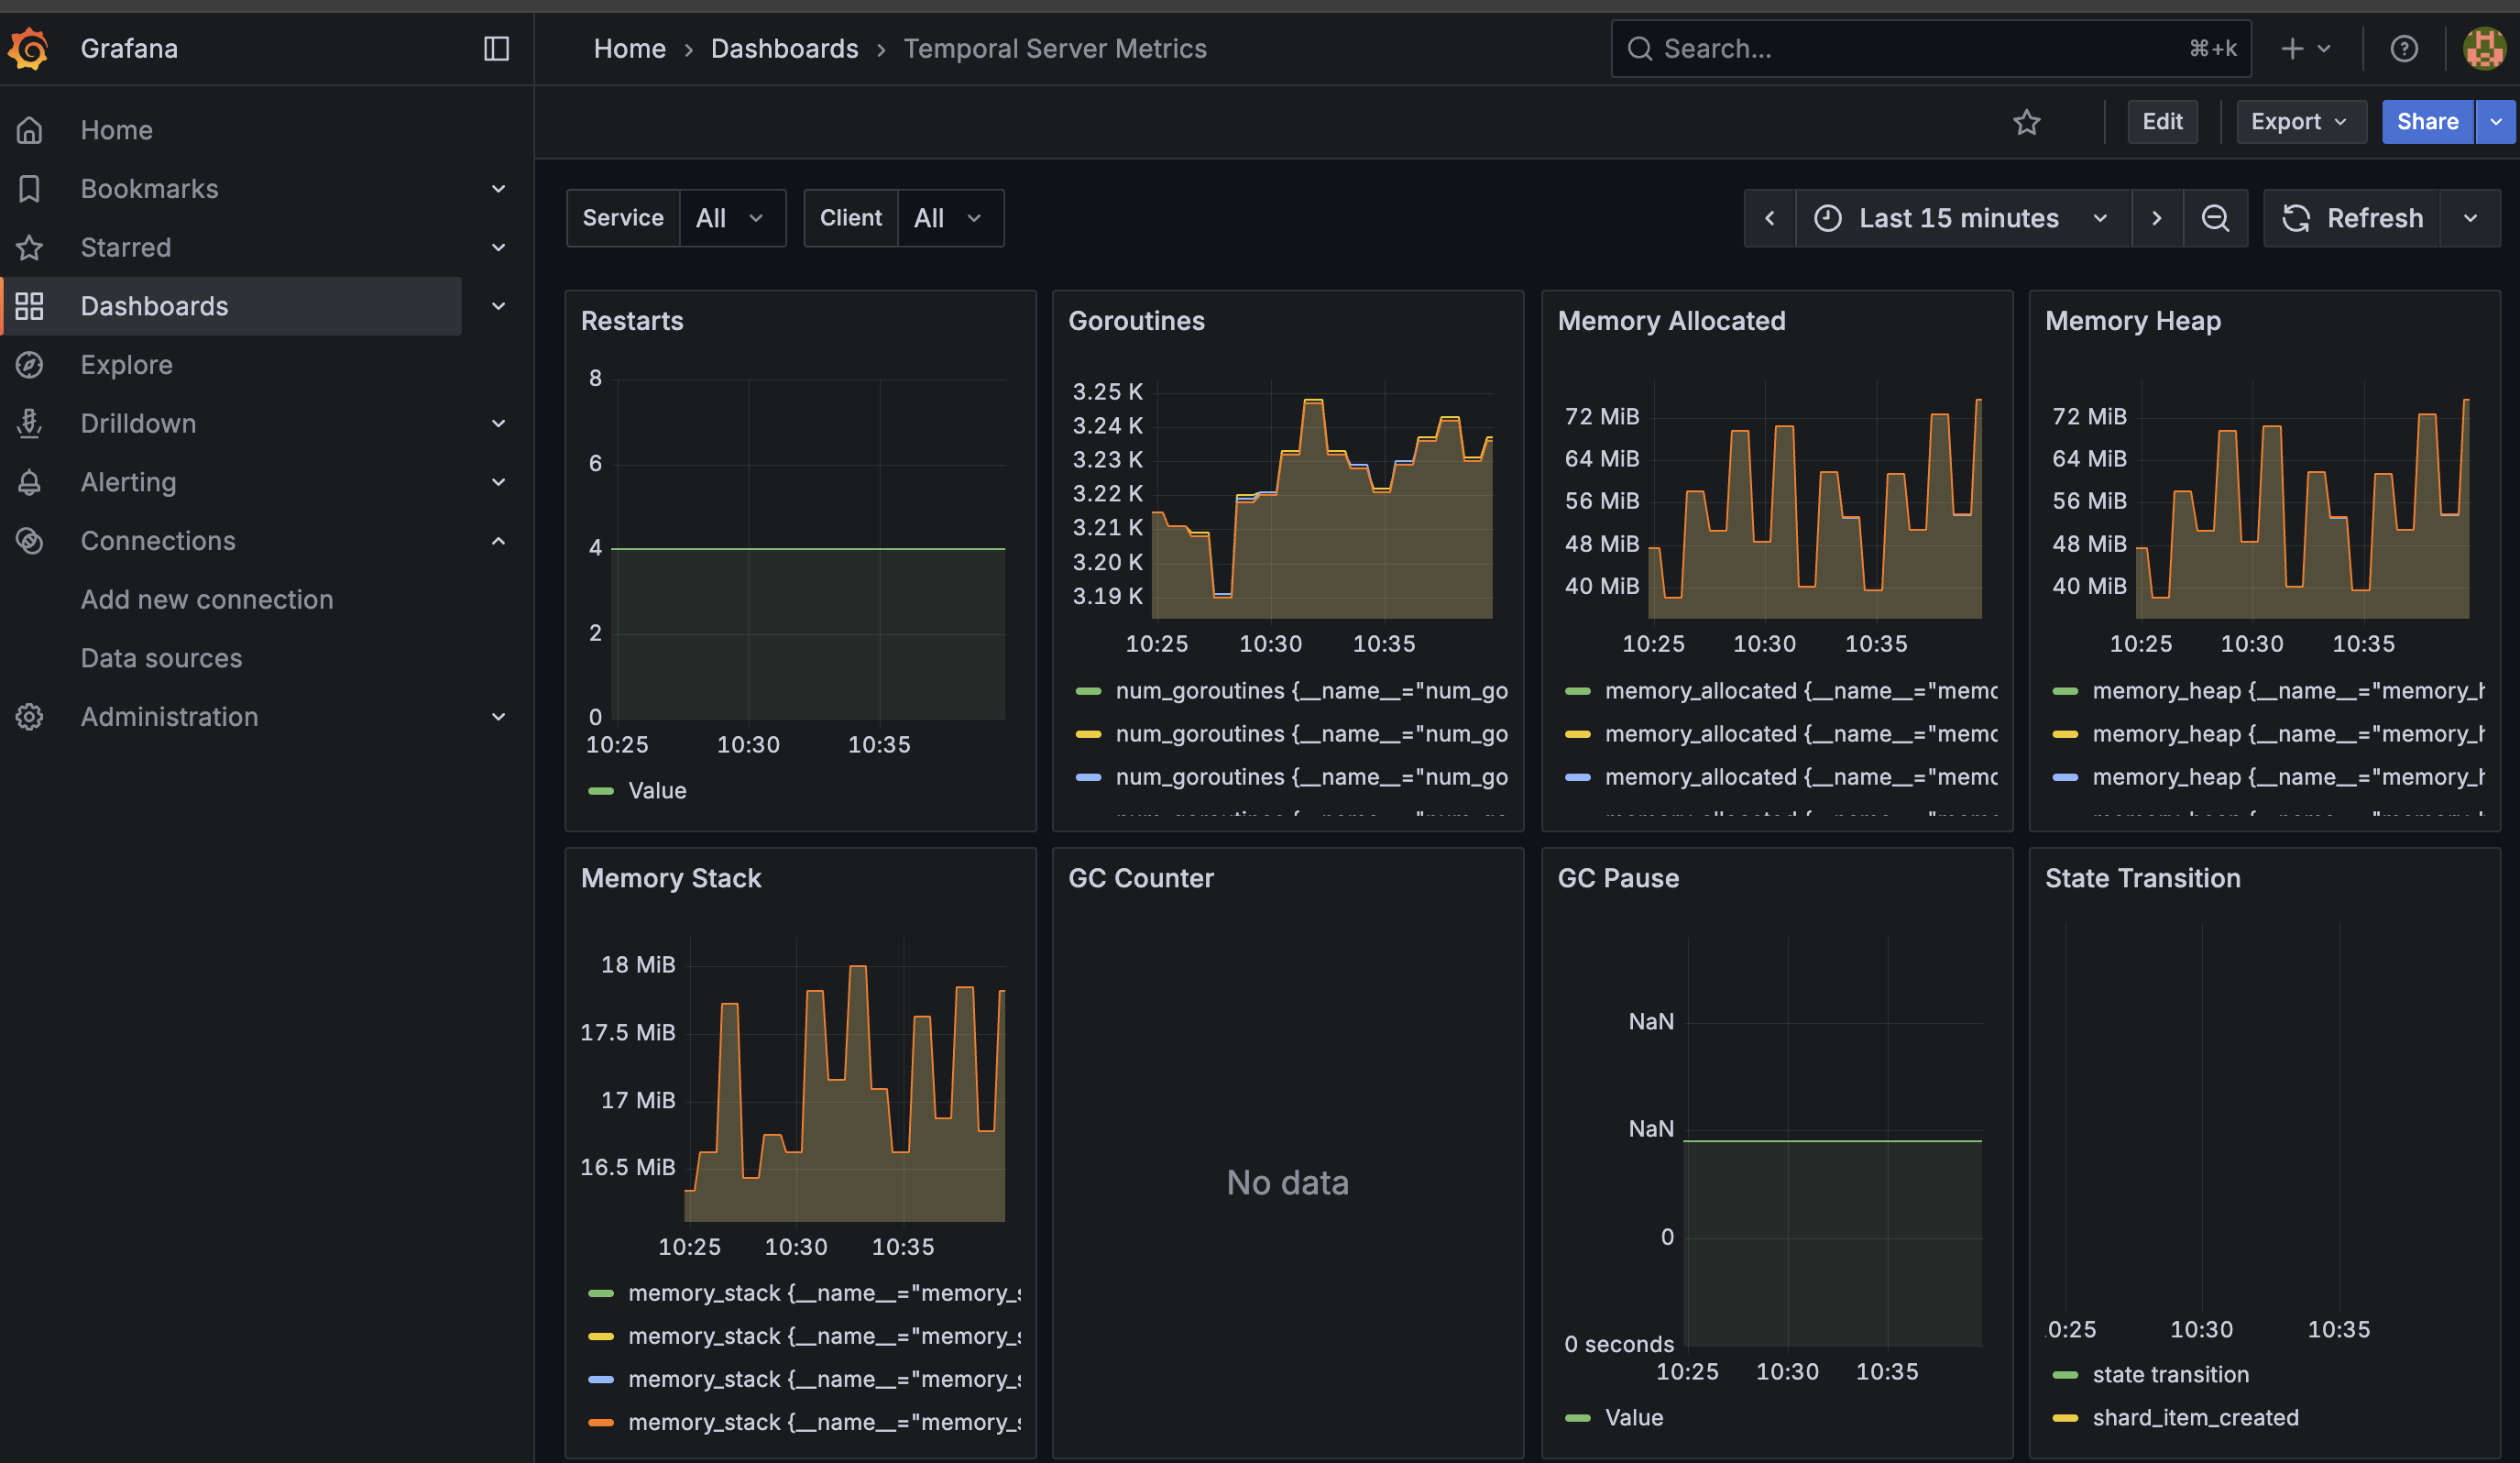
We provide community-driven Grafana dashboards that can be used for monitoring Temporal Server and SDK metrics in a dashboards repo. Follow the instructions in that repo's README to import the dashboards to Grafana.
This way, you can create at least one dashboard for monitoring server metrics:
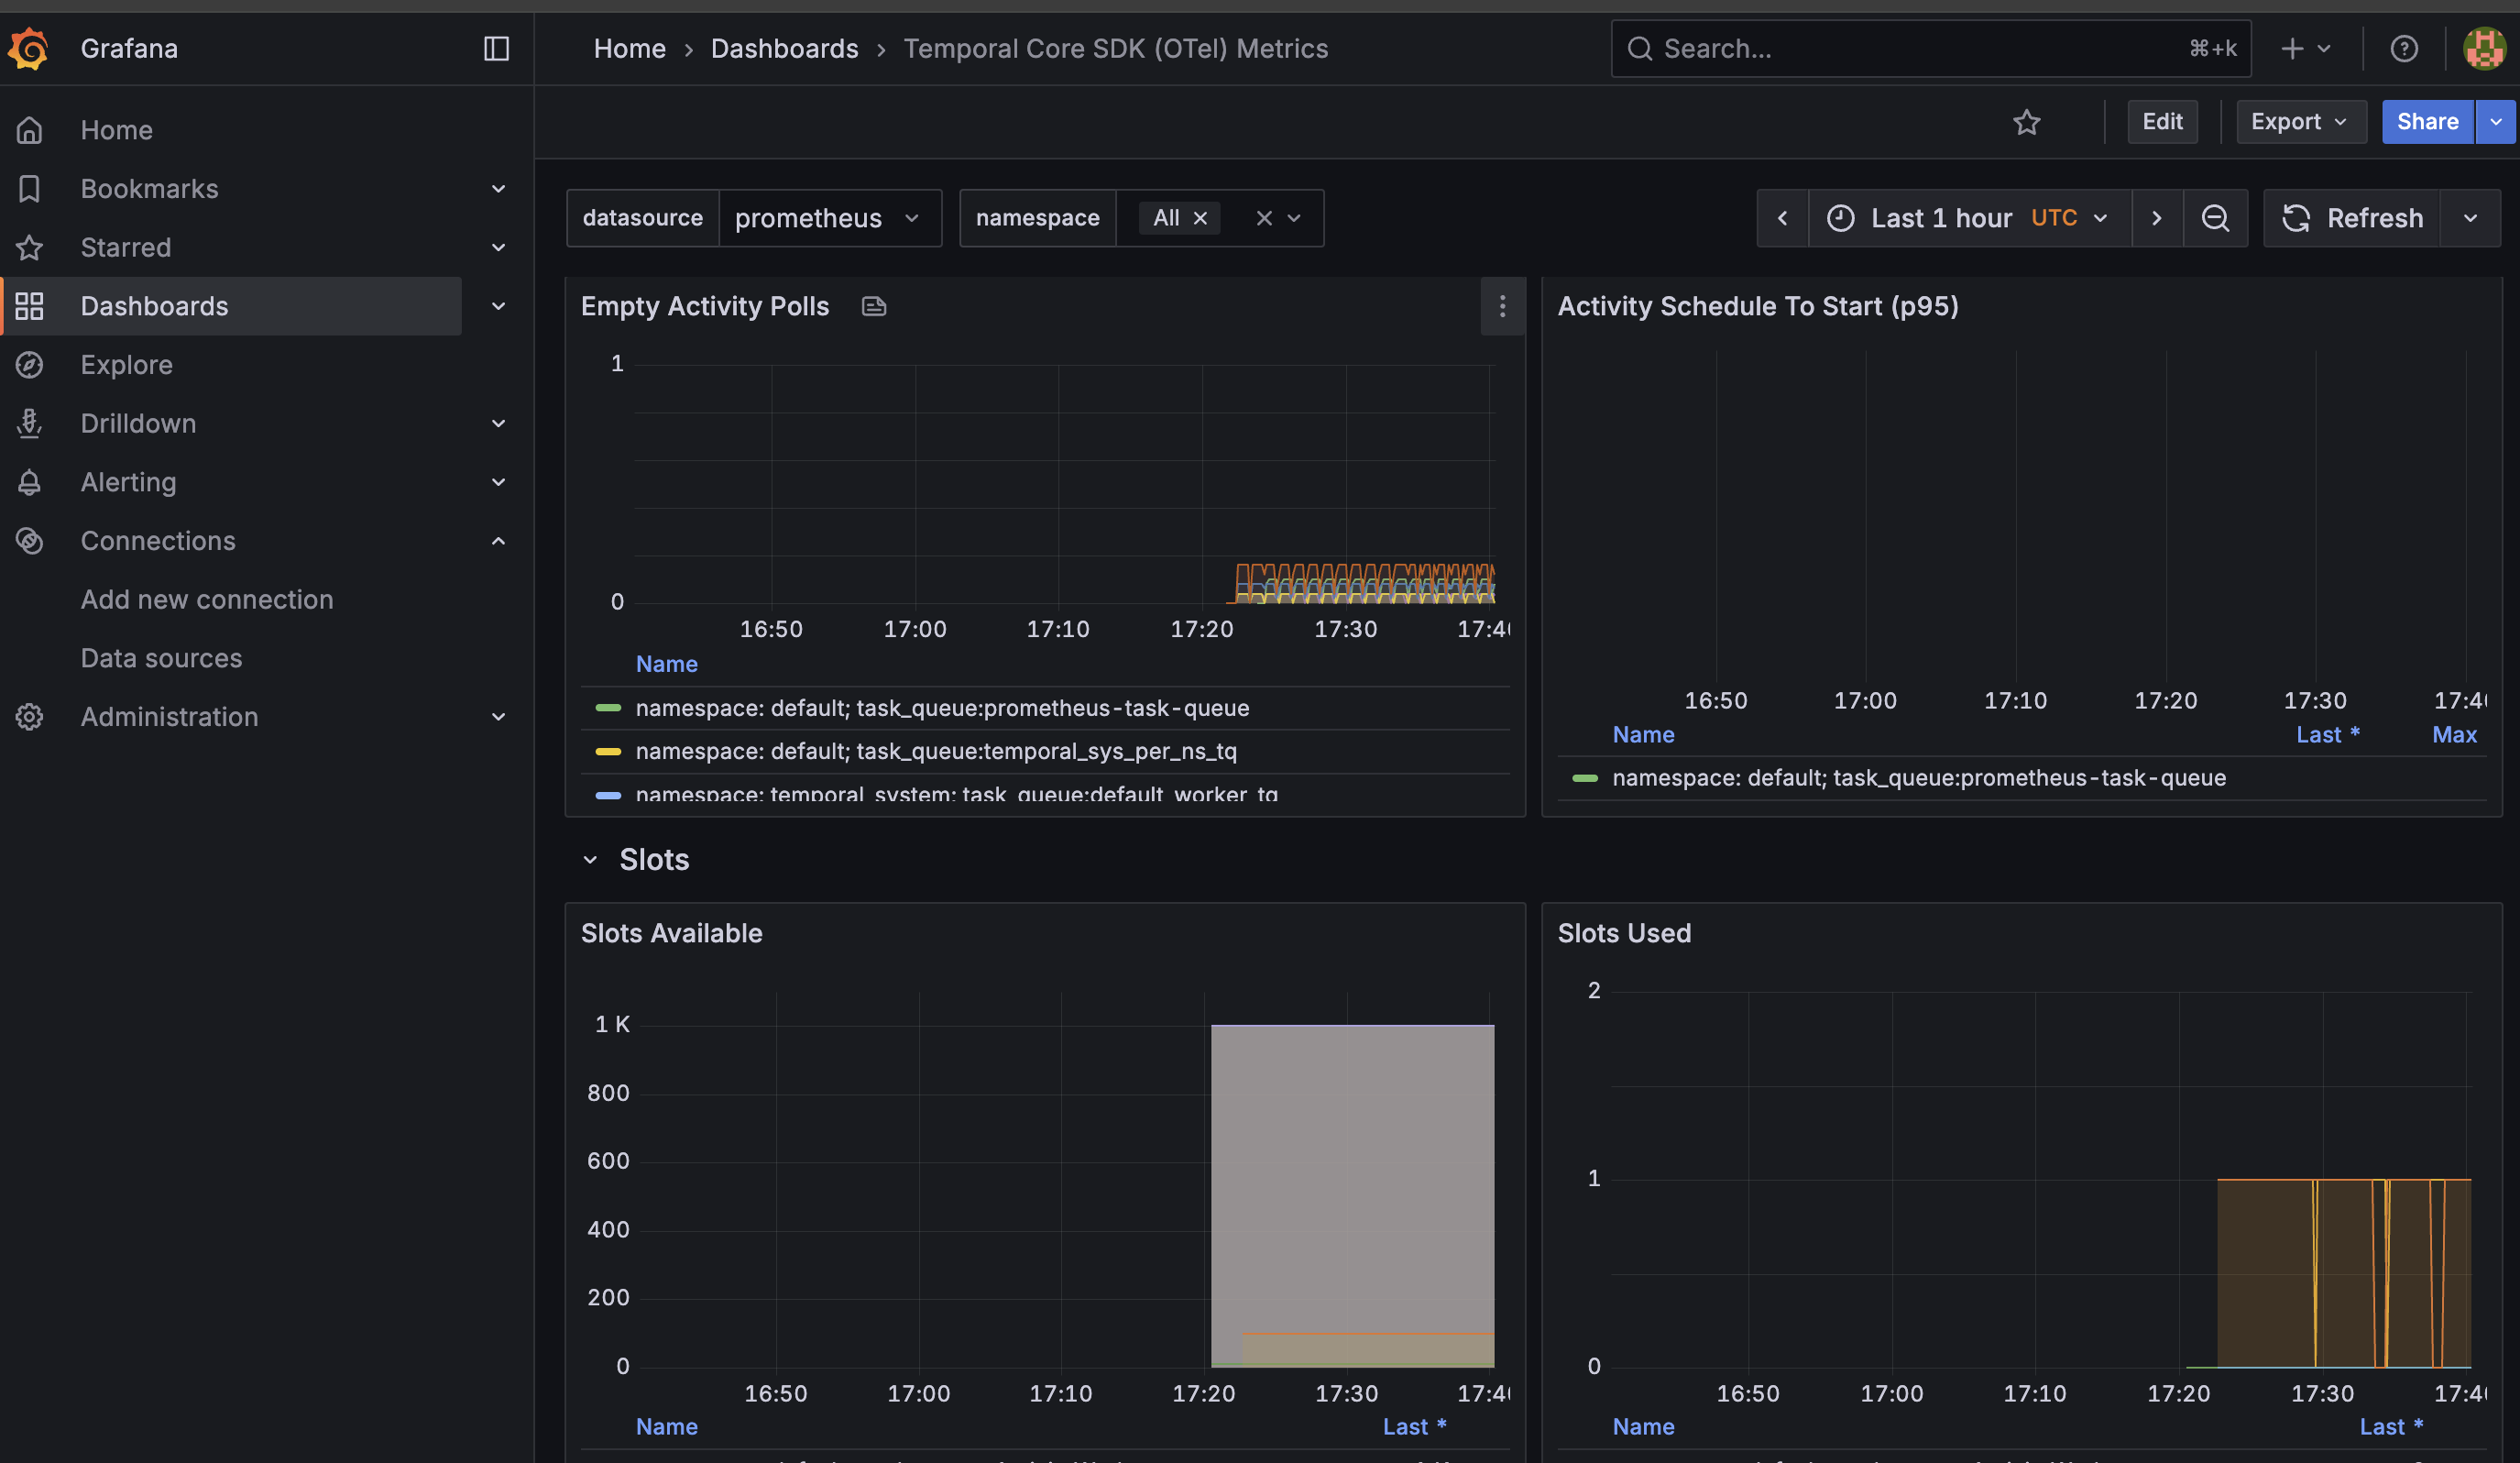
And at least one other dashboard for monitoring SDK metrics:
You can provide additional queries in your dashboard to report other data as needed. For more details on configuring Grafana dashboards, see the Grafana Dashboards documentation.
From here, you can configure Grafana Alerts for any monitored parameters, add custom metrics to your Temporal SDK code, and use these observability features to help scale your Temporal deployment. Refer to the Cluster metrics and SDK metrics reference for more.
Configuring Temporal Service health checks
The Frontend Service supports TCP or gRPC health checks on port 7233.
If you use Nomad to manage your containers, the check stanza would look like this for TCP:
service {
  check {
    type     = "tcp"
    port     = 7233
    interval = "10s"
    timeout  = "2s"
  }
or like this for gRPC (requires Consul ≥ 1.0.5):
service {
  check {
    type         = "grpc"
    port         = 7233
    interval     = "10s"
    timeout      = "2s"
  }
Installing via Helm Chart
If you are installing and running Temporal via Helm chart, you can also provide additional parameters to populate and explore a Grafana dashboard out of the box.
Datadog
Datadog has a Temporal integration for collecting Temporal Service metrics. Once you've configured Prometheus, you can configure the Datadog Agent.
If you are using Temporal Cloud, you can also integrate Datadog directly, without needing to use Prometheus.